At the end of the 2013 Major League Baseball (MLB) season, the New York Mets, Chicago Cubs, and Toronto Blue Jays all had losing records. They were all in the bottom 1/3 of all MLB teams that year. The Cubs and Blue Jays finished last in their respective divisions, and the Mets finished right in the middle of theirs. The Kansas City Royals finished 3rd in their own division despite winning 53% of their games. The Cubs and Mets were still lost more than half of their games in 2014. Some of these teams had hope for the near future, but if you had told MLB officials that the final 4 teams in the 2015 playoffs would be Toronto against Kansas City, and Chicago against New York, they wouldn’t have believed you on ANY of those teams.
Even as recently as the start of this season, almost nobody picked any of these teams (even 2014 playoff darling Kansas City) to make the playoffs, let alone be on the doorstep to the World Series. Forty-two percent of ESPN’s “experts” picked the Washington Nationals to win it all, with the Seattle Mariners being the most popular choice to play them in the World Series, and neither team even made the playoffs! The results were very similar among the writers at Fan Graphs and Baseball Prospectus.
These are smart people who watch and analyze baseball every day, and yet nearly every single one of them missed these picks. Why? How could so many individual, competent professionals, and even our best computer prediction models, been so far off?
The answer has to do mainly with probability. While the possibility was recognized, the odds were against any of these teams making the playoffs. Many of these teams achieved what was only about a 5% chance for success. If this exact season was played 100 times, this would only happen in around 5 of those seasons, for each individual team. But this is the season that was played, and this is the season where hope overcame doubt. As they say, that’s why we play the games.
***
Physicians are taught to think in this probabilistic way. When a patient begins telling a doctor her/his symptoms, we immediately start to formulate differential diagnoses, or all of the possible things that could be causing the problem. We listen and ask for things that will guide our thinking of the differential to shorten the list. We then create relative probabilities of what the most likely issue is, though not in specific numbers.
For example, if a person tells us that they have abdominal pain, then we begin to think of the 100+ possible problems. If it hurts in their upper abdomen that could mean a whole slew of different things then if the pain is lower. So we ask, and prod, and examine, and use all of the available information that we have to establish the most likely diagnosis. Sometimes this requires lab or imaging studies, mainly when there are multiple possibilities that are equally likely after hearing the story and examining the patient. Tests will also follow commonly if a serious diagnosis is a strong possibility, even if it is less likely than the most apt diagnosis. So while we recognize pancreatic cancer as a potential cause of their abdominal pain, it is rarely the most likely.
But bad things, such as pancreatic cancer, DO happen, even when they are improbable. So how might one differentiate between pain from a viral gastroenteritis (stomach bug) and cancer? Usually by trial and error. We do the tests or try treatments and if the patient doesn’t respond, then we start checking things off of our list and looking at the next most likely.
Most people do not think like this. People are mainly driven by stories as opposed to mathematics. This is human nature; probabilities are abstract and not always well understood, whereas experiences and stories make sense to us. It is not uncommon for a patient to come see their primary care physician with a preconceived notion of what is wrong that does not fit the probabilistically-trained physician. This can often lead to patient dissatisfaction and frustration. “I have some abdominal pain and have been a little constipated. My cousin had these same symptoms and it turned out that she had colon cancer.” It’s possible the doctor will roll his/her eyes at this notion, not because it’s impossible that colon cancer could be causing the problem, but because there are other reasons that are much more likely to produce this ailment.
The trick is then for patients and physicians to work together to figure out the best approach. Maybe simple explanation of why each of them are thinking the way they do is enough, or possibly starting treatment for the most likely cause with close follow up. But it is important for both patients and physicians to not judge one another based on the eventual outcome.
“Boy, I saw the stupidest patient who was convinced that she had colon cancer merely because she was constipated! But she doesn’t drink water or eat any fiber, so why in the world would she think its cancer?!?”
“That doctor I saw for this pain was a moron! He told me to change my diet and gave me a laxative, and completely missed my cancer diagnosis.”
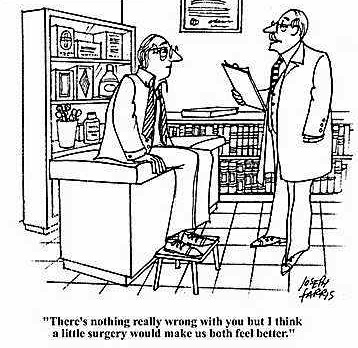
It’s this disparate thinking that is the biggest underlying reason for malpractice suits. We all come from different backgrounds with different experiences and different ways of approaching problems. Just because you do it differently from me doesn’t make you stupid. But the lack of recognition and communication of this problem is a big driver of over-testing when it’s unnecessary. Most physicians and patients accept the other person’s point of view once proper communication takes place. Being open lessens the diagnostic errors, as well as decreases unneeded and potentially dangerous procedures, tests, and treatments.
So are all of those baseball prognosticators idiots? Maybe, but it’s not because of their playoff picks. They evaluated all of the information at their disposal, figured what would be the most likely outcome, and picked accordingly. Even though almost none of them were correct, they can hardly be faulted for why they chose the teams that they did. So it is in medicine. Physicians will be wrong. Patients will be wrong. That’s how it works when you play the percentages. We just need to remember that impossible and improbable are not the same thing.
